Follow The Stock Market With More Confidence By Using These Useful Tools

It is a common misconception that to be successful in the stock market. It would help if you were an expert investor with years of experience. While it is certainly helpful to have a strong understanding of the market and the economy, many tools and resources available today make it easier than ever for anyone to invest confidently. The right tools can give you the insights you need to make smart investment decisions and help you stay on top of the market so you can react quickly to changes. Here are some useful tools to use to follow the stock market with more confidence.
1. The moving average convergence divergence (MACD) indicator
The MACD indicator is a popular technical analysis tool used to track the price of stocks and commodities. The MACD indicator is based on the moving average convergence divergence (MACD) theory, developed by Gerald Appel in the 1970s.
The MACD indicator consists of three lines: the MACD line, the signal line, and the histogram. The MACD line is calculated by subtracting the 26-day exponential moving average (EMA) from the 12-day EMA. The signal line is calculated by taking the 9-day EMA of the MACD line. When setting for MACD, the most common parameters are 12, 26, and 9. The histogram is created by subtracting the signal line from the MACD line.
The MACD indicator can track the price movement of stocks and commodities over time. It can identify trend reversals, momentum shifts, and support and resistance levels. It can also be used to generate buy and sell signals. Many traders find that the MACD indicator is one of the most reliable indicators for identifying profitable trading opportunities.
2. The Relative Strength Index (RSI)
The RSI is a popular technical analysis tool used to track the price of stocks and commodities. The RSI is based on the relative strength index (RSI) theory, developed by J. Welles Wilder in the 1978 book New Concepts in Technical Trading Systems.

The RSI is calculated by taking the stock’s gains average over the past 14 days and dividing it by the average of the stock’s losses over the past 14 days. The RSI ranges from 0 to 100. A stock is considered to be overbought when the RSI is above 70. Also, it is considered oversold when the RSI is below 30.
The RSI can track the price movement of stocks and commodities over time. It can identify trend reversals, momentum shifts, and support and resistance levels. It can also be used to generate buy and sell signals.
3. The Ichimoku Cloud
The Ichimoku Cloud is a technical analysis tool developed in Japan in the 1930s. It is a versatile tool that can be used to measure trend direction, momentum, and support and resistance levels.
The Ichimoku Cloud consists of five lines: the Tenkan Sen (blue line), the Kijun Sen (red line), the Chikou Span (green line), the Senkou A (orange line), and the Senkou B (purple line).
The Tenkan Sen and Kijun Sen are the moving averages of the prices, and the Chikou Span is the moving average of the Tenkan Sen. The Senkou A and B lines are calculated by taking the intersections of the two moving averages and adding them together.
The Ichimoku Cloud can identify trend reversals, momentum shifts, and support and resistance levels. It can also be used to generate buy and sell signals. Many traders find that the Ichimoku Cloud is one of the most reliable indicators for identifying profitable trading opportunities.
4. The Fibonacci Retracement Tool
The Fibonacci Retracement Tool is a popular technical analysis tool used to track the price of stocks and commodities. The Fibonacci Retracement Tool is based on the Fibonacci sequence, which Leonardo Fibonacci developed in the 13th century.
The Fibonacci Retracement Tool consists of three lines: the 0.382 lines, the 0.500 lines, and the 0.618 lines. These lines are created by taking the Fibonacci ratios of 23.6%, 38.2%, and 61.8% and applying them to the stock’s price movement.
The Fibonacci Retracement Tool can identify trend reversals, momentum shifts, and support and resistance levels. It can also be used to generate buy and sell signals. Many traders find that the Fibonacci Retracement Tool is one of the most reliable indicators for identifying profitable trading opportunities.
5. The Elliott Wave Principle
The Elliott Wave Principle is a popular technical analysis tool used to track the price of stocks and commodities. The Elliott Wave Principle is based on the theory of market cycles, which Ralph Elliott developed in the 1930s.
The Elliott Wave Principle consists of three waves: the impulse wave, the corrective wave, and the terminal wave. The impulse wave is created by taking the Fibonacci ratios of 23.6%, 38.2%, and 61.8% and applying them to the stock’s price movement. The corrective wave is created by taking the Fibonacci ratios of 50%, 62.8%, and 100% and applying them to the stock’s price movement. The terminal wave is created by taking the Fibonacci ratios of 78.6% and 100% and using them for the stock’s price movement.
The Elliott Wave Principle can identify trend reversals, momentum shifts, and support and resistance levels. It can also be used to generate buy and sell signals. Many traders find that the Elliott Wave Principle is one of the most reliable indicators for identifying profitable trading opportunities.
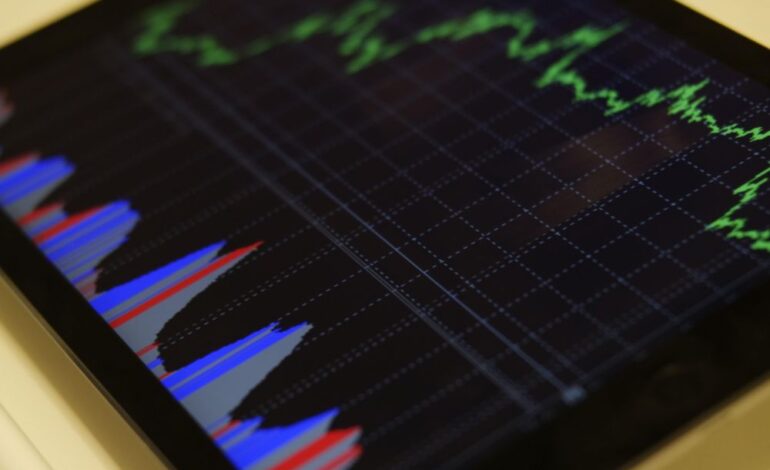
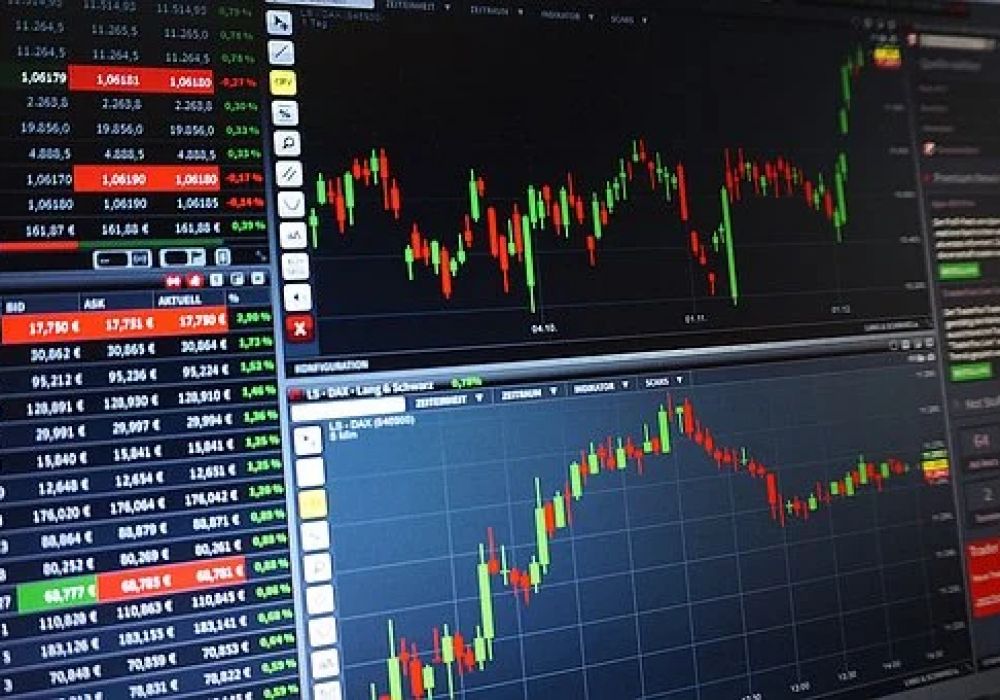
6. The Candlestick Chart
The candlestick chart is a popular technical analysis tool used to track the price of stocks and commodities. The candlestick chart is based on the Japanese candlestick charting technique, which was developed in the 1700s.
The candlestick chart consists of a series of rectangles called candles. The candle’s body is the rectangle located at the candle’s center. The wick is the line that extends from the top of the body to the top of the candle. The bottom of the wick is called the tail.
The candle’s color indicates whether it closed higher or lower than it opened. A white candle indicates that the stock closed higher than it opened, and a black candle indicates that the stock closed lower than it opened.
The candlestick chart can track the price movement of stocks and commodities over time. It can identify trend reversals, momentum shifts, and support and resistance levels. It can also be used to generate buy and sell signals. Many traders find that the candlestick chart is one of the most reliable indicators for identifying profitable trading opportunities.
Traders can use different technical analysis tools to follow the stock market more confidently. The most popular and reliable indicators for identifying profitable trading opportunities are listed above. By using these tools, traders can better understand the market and make more informed decisions about when to buy and sell stocks.